
Summary
- Gold and silver investments have been strong performers since December, and this trend may continue for years.
- Record negative real yields in the U.S. bond market will not be corrected quickly or easily, encouraging investors to purchase precious metals.
- Gold/silver prices and valuations “relative” to other asset classes remain in strong buy territory.
- Long-term technical momentum trends have been turning higher for the monetary metals since 2015.
m.czosnek/E+ via Getty Images
I have been explaining my long-term bullish views on precious metals assets with greater frequency since September on Seeking Alpha, and I remain skittish on Wall Street valuations for equities generally vs. a sharply rising interest rate trend. Following the sell-off in stocks in early 2022 and new interest by investors in safe-havens with the start of the Russia/Ukraine war, the winds of change for pricing/valuing the two asset classes seem to be reversing, with long-term consequences to recognize. This article will focus on technical price/trading action as a validation of changes in asset class supply and demand dynamics by investors.
Background Fundamental Ideas
I have argued the adjusted “fair value” for gold (using 60-year averages comparisons to total Treasury debt, basic money supply measures, other commodities, and stock market wealth) is nearing $3,000 an ounce in 2022. So, today’s price under US$2,000 an ounce is actually undervalued vs. its “relative” trading history since we left a gold standard for dollars in the early 1970s. You can reread my effort laying out some of my gold valuation facts in an article posted during September here, with the headline – $1800 Gold Is Cheaper Than You Think.
Believe it or not, despite what you hear on CNBC or read in the WSJ, gold/silver performance goes through cycles and spurts like any other financial asset or commodity. Between the year 2000 and 2011, gold/silver were actually the “best” place to hide your wealth and investments from then modern-record money printing levels and aggressively suppressed central bank interest rates.
However, since precious metals peaked in 2011, Wall Street stock ownership in general businesses has widely outperformed hard money assets. The good news for precious metal investors is gold bottomed in 2015 and silver reached a panic spike bottom in early 2020 with the onset of the pandemic. For several years already, gold/silver assets have been performing better than analysts or the mass media is giving credit.
In fact, a variety of relative technical-based price movements and measurements since 2015 are now arguing the long-term trend in gold and silver assets has improved, with bullish undertones starting to take control of price. At this point in history, record negative “real” yields in western-nation money markets make gold/silver extremely attractive to investors, perhaps more so than any other time in my 35+ years of trading. Versus CPI inflation in America of close to 8% YoY, money market yields under 1% are not responsible central bank policy and could quickly jeopardize demand for U.S. dollars globally. This unsustainable spread is the reason Federal Reserve bank policy voters are running scared in early 2022 and expressing concern rates need to rise 2% or 3% this year, as a minimum, to slow inflation gains.
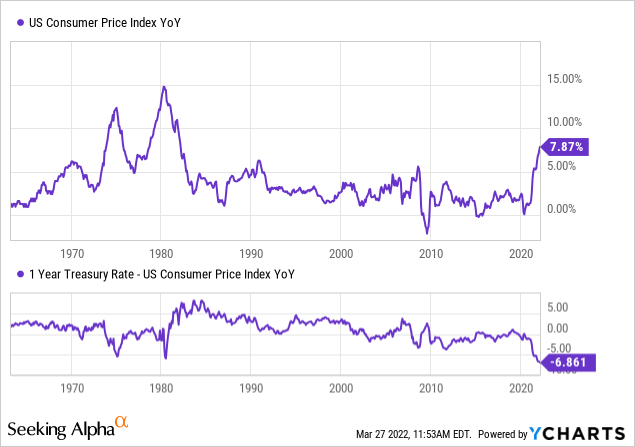
Record U.S. Negative Real Yields – YCharts
The dirty secret many retail investors do not understand, it could take years to rebalance the economy and macro levels of supply/demand in most every good/service after the pandemic disruptions to the world. So, forecasting a multi-year period of chaotic swings in the stock and bond markets, with increasing flows into sound money gold/silver assets is far from a stretch. Anticipating a better environment to own precious metals is actually the only logical conclusion. As such, I remain confident gold/silver bullion and related blue-chip mining investments should be an overweight position in long-term portfolio construction.
Technical Evidence to Increase Gold/Silver Exposure
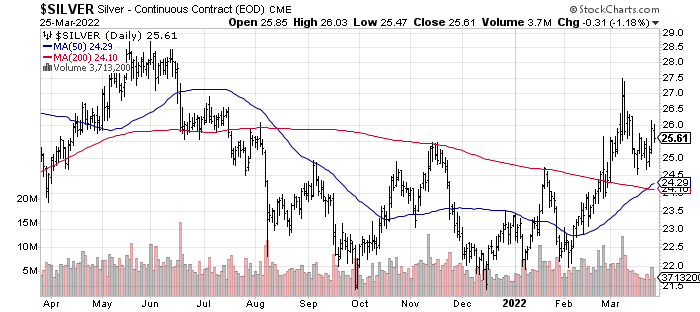
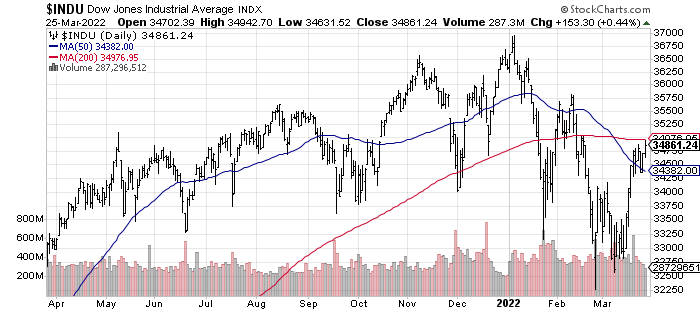
From a short-term perspective, gold and silver have been outperforming the stock market since late 2021. Below are 12-month charts of daily trading action in nearest-contract gold and silver futures, plus the Dow Jones Industrials. Notice the precious metals are trading above and turning higher the important 50-day and 200-day moving averages, while the longest standing U.S. blue-chip investment index is struggling with the reverse situation.
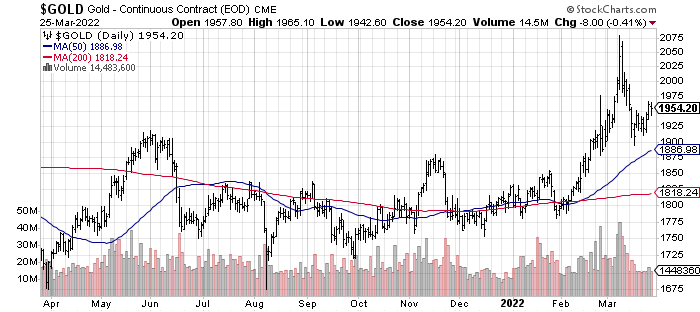
StockCharts.com
StockCharts.com
StockCharts.com
Long-Term Price Changes
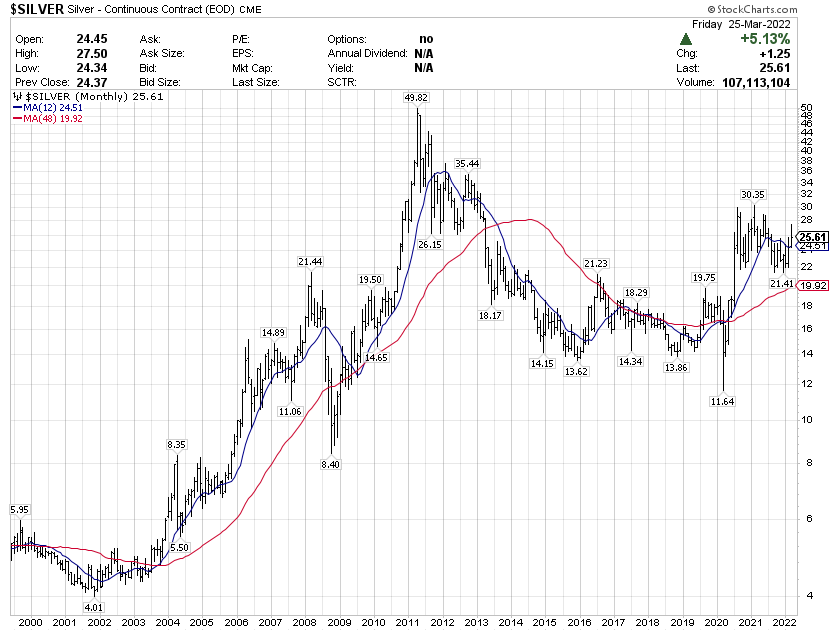
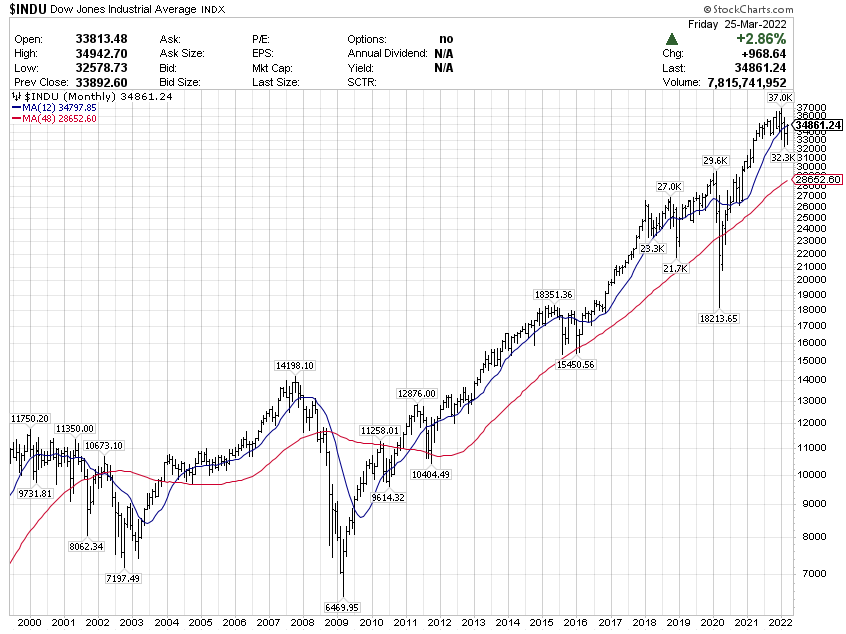
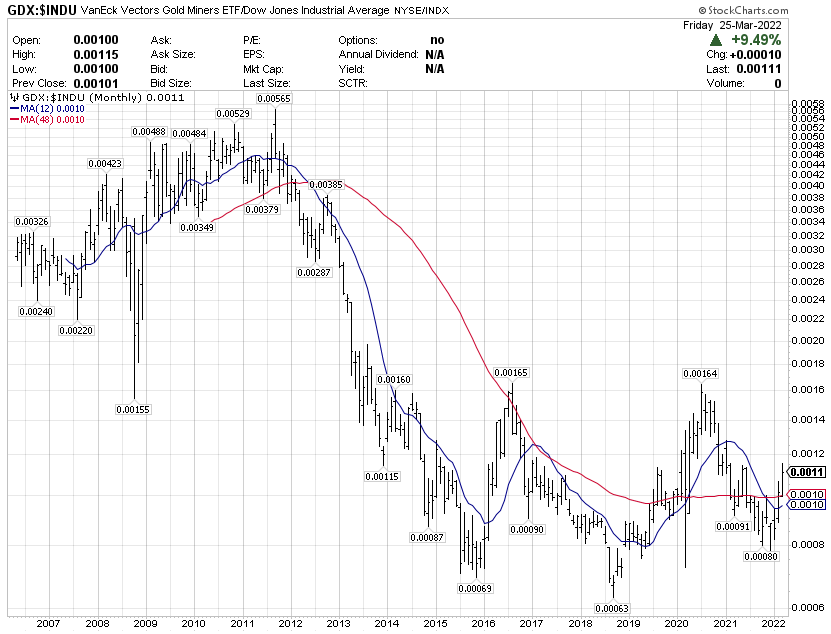
A more interesting technical bottoming phase can be seen on longer-term monthly charts comparing gold/silver to the Dow Industrials. Below are charts for each since 1999 with 1-year (12-month) and 4-year (48-month) moving averages drawn.
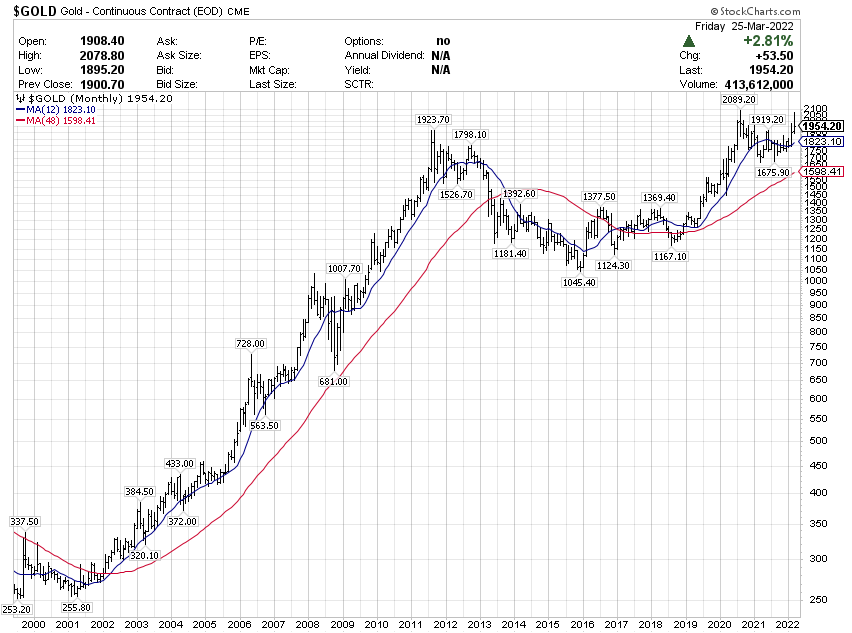
StockCharts.com
StockCharts.com
StockCharts.com
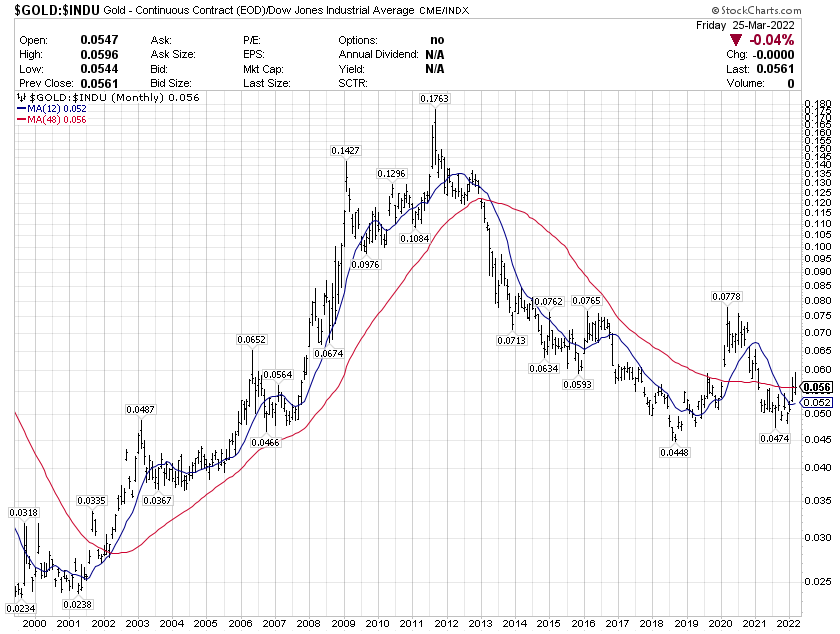
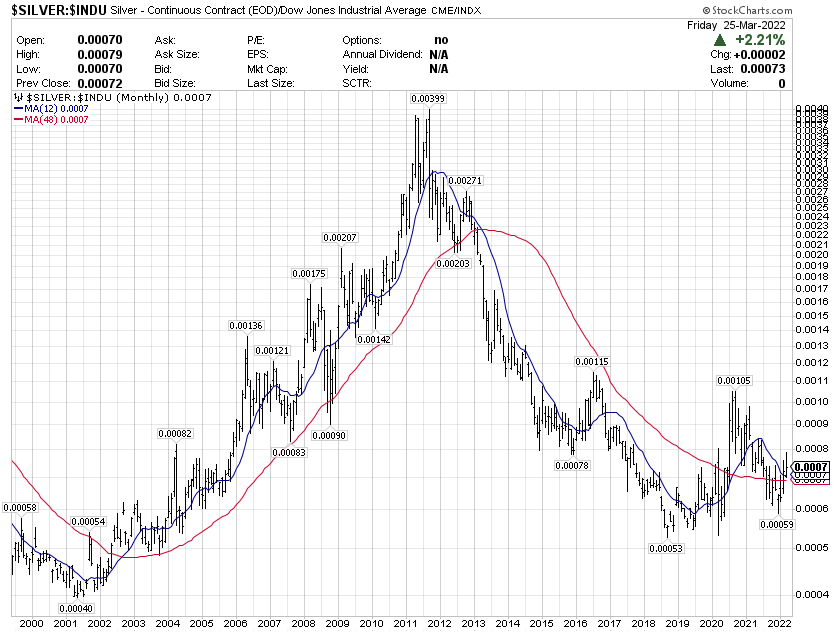
Useful research value comes when plotting changes in one asset class against the other. Below are price charts for both gold and silver relative to the 30 Dow stocks over decades of trading.
StockCharts.com
StockCharts.com
The conclusion we can extrapolate is gold and silver bullion have actually performed in line with the Dow names since 2018. And, this improving price pattern looks a lot like the once-in-a-generation bottom between 2000 and 2004. In terms of long-term cycles in movements between precious metals and stocks, another once every 20 to 30-year buy point in precious metals may have been outlined the past 3-5 years.
Mining Investments
The largest AUM investment in a diversified list of gold/silver miners is the VanEck Vectors Gold Miners ETF (GDX). Comparisons to both the Dow Industrials and spot gold price indicate the strongest mining names may be ready to outperform Wall Street investments overall and gold bullion during the coming years. At a minimum, I expect major gold miners to perform in line with the Dow Industrials or S&P 500 index over the next 3-5 years, like they did between 2000 and 2011.
StockCharts.com
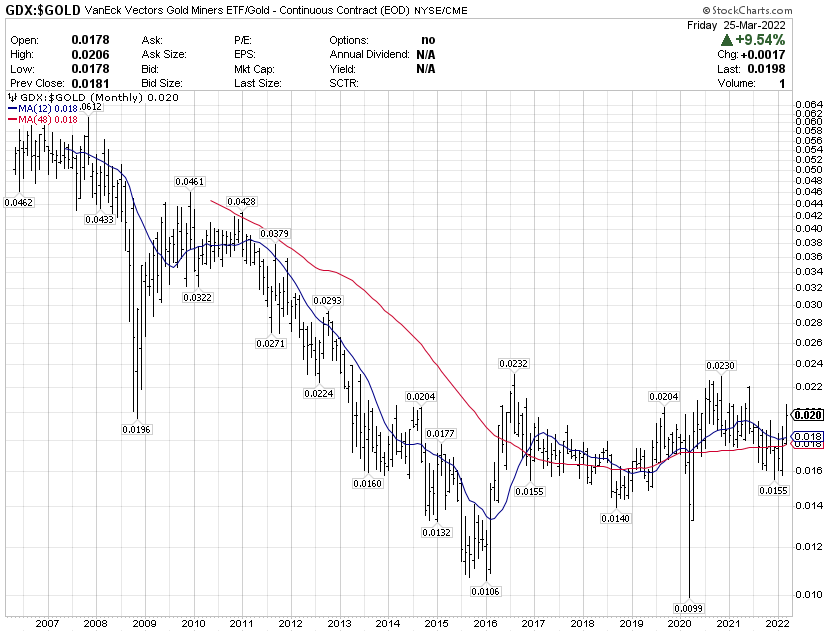
StockCharts.com
And, if you want to concentrate on the two largest and best-situated international gold miners, Newmont (NEM) and Barrick Gold (GOLD) have performed even better than the GDX setup over long periods of time. I have talked about both mining companies over the last year as the smartest risk-adjusted, precious metal investment ideas after bullion holdings.
Below are charts comparing/contrasting price gains and losses vs. the GDX index since its inception in 2006. Newmont has been the clear winner over 15+ years, but Barrick has been doing much better since 2015, when it decided to get serious about reducing debt and hedging initiatives.
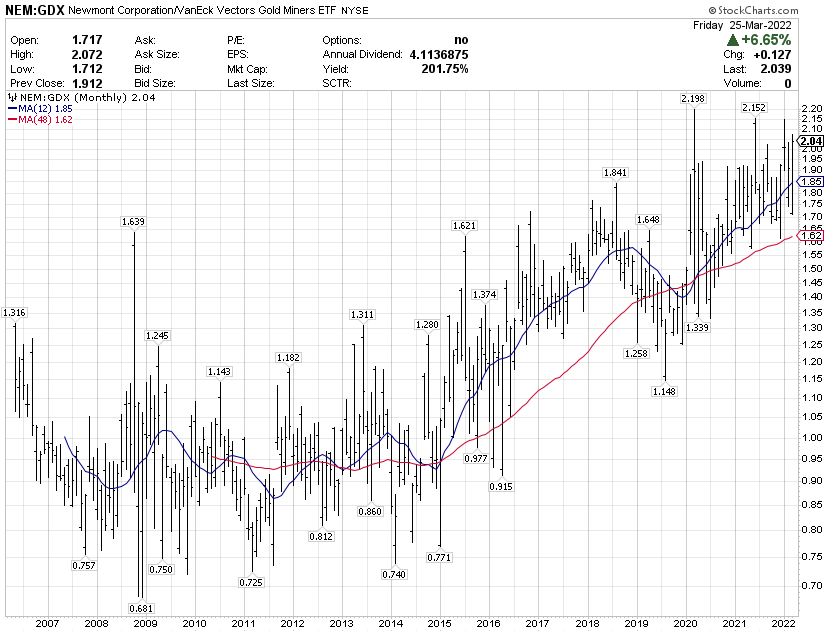
StockCharts.com
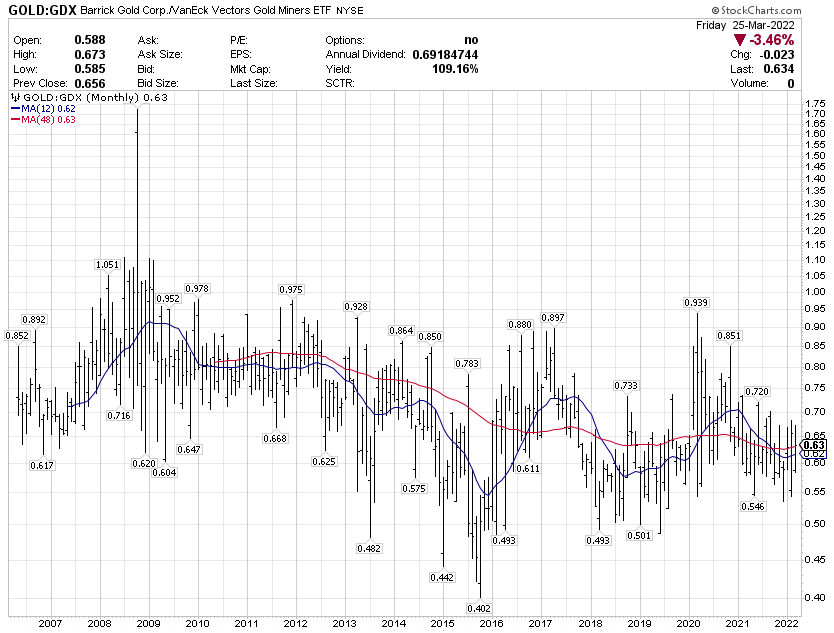
StockCharts.com
Final Thoughts
In my view and experience, the rotten/bearish drop in price and interest by investors for gold/silver positions between 2011 and 2015 is unlikely to be repeated anytime soon. Negative real yields in money markets have been highly correlated with robust gold/silver gains historically in numerous currencies, including the U.S. dollar. Until short-term interest rates rise ABOVE the prevailing rate of inflation, the normalized money market condition over hundreds of years of American economic history, I strongly believe global investors will gravitate toward hard money holdings as an alternative.
The Federal Reserve is stuck between opposing forces now. If they try to keep stocks and bonds high in price, inflation could skyrocket above 10% annually. Under this scenario, unrest in the streets and the odds of civil disobedience against U.S. authorities could explode. If you watch the news, unions are gaining ground in popularity for higher wages (Amazon and Starbucks efforts come to mind), and approval surveys for politicians and the U.S. central bank are beginning to plummet (President Biden‘s lowest approval ratings were reached last week). Such would be a wildly bullish scenario for gold/silver.
On the other hand, if banks raise interest rates, an economic recession is likely with lower stocks/bonds/real estate values all but assured. Plus, Uncle Sam would have to pay real-world interest expense on $30 TRILLION in outstanding IOUs. Since most of America’s sovereign debt is front-loaded in short-term maturities less than a few years out, every 1% increase in interest rates paid by the Treasury will add about $200 billion in annual outlays on PAST government spending. If interest rates rise to 5% on the short-end, another $1 TRILLION in yearly interest will be added to our structural deficit now in the $1 to $1.5 TRILLION range. It would be a huge anchor tied to a staggering swimmer as an analogy for the economy. Inflation-adjusted GDP growth would become next to impossible, and much suffering would take place for working Americans as interest costs explode on consumer debt. This scenario of recession and rising debt defaults would also force investors and foreign governments into the gold/silver markets.
The problem is the Fed will not be able to easily wiggle out of this mess, or just print money to escape outrageous debts built over many decades. So far, the U.S. authorities have chosen a path of “soft default” through rising inflation to reduce the burden of humanity’s greatest debt load in history. The idea was (and is) citizens will be more willing to accept the repercussions of rising prices for goods and services, as opposed to a “hard default” of America reneging on its debts. In my book, both are problematic for investors, and you hedge escalating debt and money printing issues with long-term holdings of precious metals.
I have told anyone willing to listen for many years, you “vote” your displeasure regarding ultra-easy Federal Reserve policy and out-of-control spending by Washington politicians through a purchase of gold and silver. When you buy precious metals, you are also selling fiat paper dollars in the process. We have already moved from $255 an ounce in 2001 to $2,000 twenty years later. That’s a huge devaluation of each dollar’s worth, when you think about it, and an even farther cry than $35 an ounce in 1967.
Projecting $3,000 gold by 2024 is not a stretch. And, those calling for yet higher quotes of $5,000 or $10,000 will be proven correct in time. Our debts are too large and inflation is galloping ahead, meaning the dollar’s value could easily plunge with the next economic crisis. Food for thought anyway.
Thanks for reading.
This article was written by

Disclosure: I/we have a beneficial short position in the shares of SPY either through stock ownership, options, or other derivatives. I wrote this article myself, and it expresses my own opinions. I am not receiving compensation for it (other than from Seeking Alpha). I have no business relationship with any company whose stock is mentioned in this article.
Additional disclosure: I trade into and out of a number of precious metals miners and ETFs on a weekly basis, and hold gold/silver bullion. I short index ETFs such as SPY, DIA, QQQ, IWM as portfolio hedges. Please consider this article a first step in your due diligence process. Consulting with a registered and experienced investment advisor is recommended before making any trade.
This writing is for educational and informational purposes only. All opinions expressed herein are not investment recommendations, and are not meant to be relied upon in investment decisions. The author is not acting in an investment advisor capacity and is not a registered investment advisor. The author recommends investors consult a qualified investment advisor before making any trade. Any projections, market outlooks or estimates herein are forward looking statements and are based upon certain assumptions and should not be construed to be indicative of actual events that will occur. This article is not an investment research report, but an opinion written at a point in time. The author’s opinions expressed herein address only a small cross-section of data related to an investment in securities mentioned. Any analysis presented is based on incomplete information, and is limited in scope and accuracy. The information and data in this article are obtained from sources believed to be reliable, but their accuracy and completeness are not guaranteed. The author expressly disclaims all liability for errors and omissions in the service and for the use or interpretation by others of information contained herein. Any and all opinions, estimates, and conclusions are based on the author’s best judgment at the time of publication, and are subject to change without notice. The author undertakes no obligation to correct, update or revise the information in this document or to otherwise provide any additional materials. Past performance is no guarantee of future returns.